
The short answer
The two short-circuit withstand figures on a busway nameplate do not answer the same question. The rated short-time withstand current (Icw) governs heat — what a fault current lasting a defined time does to the bars and their insulation. The rated peak withstand current (Ipk) governs force — what the first peak does to the bars and the supports holding them apart.
A banded factor links the two: the peak figure is the short-time figure multiplied by n, 1.5 to 2.2 by band. That is a test convention — it gives the ratio the two ratings should satisfy; it does not replace a figure the manufacturer has declared and verified. On site they still run apart: the prospective fault current squared times the total break time, against the short-time current squared times its rated time; and the peak from the actual network for that point, against the nameplate peak withstand.
What does each withstand current govern?
A short circuit loads a conductor two ways. One is thermal: a fault current is two orders above rated, the heat cannot escape and the temperature climbs within tens to hundreds of milliseconds. The other is mechanical: the force between adjacent conductors goes with the square of the current and peaks at the first half-cycle.
The short-time one addresses the first, its definition carrying a specified time: the r.m.s. value of a short-circuit current the assembly can carry for that time without damage putting it out of service. The peak one addresses the second, taking the highest instantaneous value reached.
One governs heat, the other governs force. An assembly can clear the thermal check and still fail on the peak: the bar cross-section sets the short-time capability, while support spacing, phase-to-phase clearance and insulating-part strength set the peak capability — different components.
What is the relationship between the two ratings?
The standard gives a definite relationship:
Ipk = n × Icw
The factor n is taken from the band the short-time current falls into:
| Rated short-time withstand current Icw | Factor n | Corresponding rated peak withstand current Ipk |
|---|---|---|
| 5 kA | 1.5 | 7.5 kA |
| 10 kA | 1.7 | 17 kA |
| 20 kA | 2.0 | 40 kA |
| 50 kA | 2.1 | 105 kA |
| 100 kA | 2.2 | 220 kA |
The table is a design convention: it aligns the two ratings in design and supplies one set of criteria for type testing. It does not mean every product's peak is worked out from that number — a manufacturer's declared, verified figure still governs.
Public catalogues bear this out: of 32 sample pairs, 26 match their band and 6 do not — some samples use one factor across the range.
The two figures cannot stand in for each other: taking "the fault current is below Icw" as a pass condition skips the peak path.
Why must the short-time withstand current carry a time?
Because it is a pair — a current and a time: "Icw = 50 kA" without a time leaves the information incomplete.
Within the range the standard allows — up to 3 s — the I²t of a given busbar is constant: shorten the time and the permissible current rises, lengthen it and it falls (a.c. periodic component only; the conditions sit next to the inequality below). A busbar rated 50 kA / 1 s:
| Total break time | Thermal check limit worked out from I²t (rounded for display) |
|---|---|
| 0.25 s | 100.0 kA |
| 0.4 s | 79.1 kA |
| 1 s | 50.0 kA |
| 3 s | 28.9 kA |
The figures are worked out from 50 kA / 1 s through
I²t = constantand carry one decimal for display only; an actual check uses the unrounded values. The column is the limit on the thermal path alone — it excludes the peak and is not an available rating.
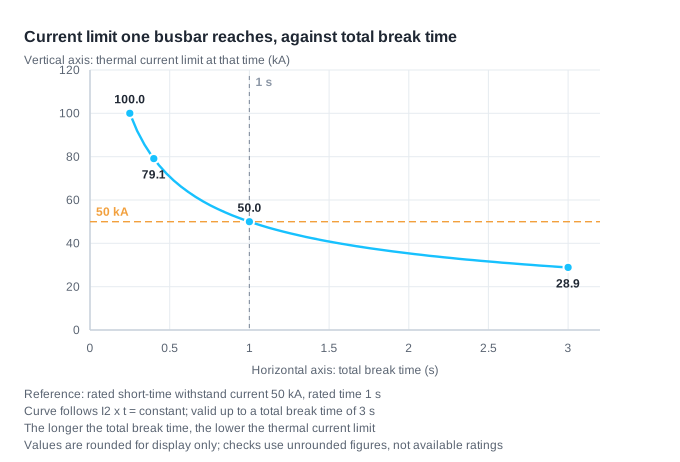
That table converts out only the limit on the thermal path: it covers neither the peak nor product testing. Clearing the thermal conversion does not mean the peak clears: carrying the conventional factor from the table over to this converted current — 0.4 s gives 79.1 kA, in the band above 50 kA, so the factor is 2.2 and the peak comes to about 174 kA — higher than the 105 kA of the original 50 kA point. That is a counter-example under the same convention, not a peak that occurs on site. A short-time withstand current with no time attached says nothing.
What does the on-site fault current get compared against?
The thermal check compares joule integral: square the prospective fault current at the installation point, multiply by the total break time of the circuit's protective device, and hold it to the short-time current squared times its rated time:
Ik² × tk ≤ Icw² × tcw
Both sides are joule integrals over the periodic component. Below a total break time of 0.1 s the d.c. component cannot be neglected; a general thermal check takes the actual ∫i(t)²dt, or an applicable equivalent thermal current, rather than this inequality.
One example: a busway rated 50 kA / 1 s on a feeder with a prospective fault current of 30 kA. 2500 ÷ 900 gives a limit of 2.7778 s — a limit, so two decimals have to be taken downwards, to 2.77 s; 2.78 s gives 2502 kA²·s, past the 2500 line. At a total break time of 0.4 s the joule integral is 360 kA²·s, inside; at 3 s, 2700 kA²·s, past it.
The mechanical check compares the peak. Keep two things apart: the on-site peak is set by the equivalent impedance ratio at the fault point and comes from the short-circuit calculation there, whereas the factor n above is a test convention for assemblies. Taking the conventional factor as an illustration: 30 kA falls in the band above 20 and up to 50 kA, the factor is 2.1, about 63 kA — not a criterion for releasing the on-site check; on site the peak from the actual network must be compared against the nameplate peak withstand.
The two checks use different quantities: one an r.m.s. value, the other an instantaneous peak — comparing across them always gets a wrong answer.
What happens when the protective operating time is lengthened?
It helps selectivity and hurts the busway: the longer the total break time, the lower the current the thermal conversion allows — the two run in opposite directions.
So that time cannot be a blanket one second; it has to be the total break time of the protective device on that circuit — from the fault occurring to the current being fully cleared, not just a short-delay setting. The setting is only part of it; the device's operating time and the breaking process count too. To fix it precisely, read that device's time-current curve at that fault current; lengthen it for selectivity and the busway side has to be re-checked.
The standard leaves a second route open. Where the fault current exceeds what the busway can carry on its own, it can be allowed not to carry it: a current-limiting device upstream clears the fault before the current reaches its peak, and the manufacturer quotes the conditional short-circuit current (Icc) — the prospective fault current the assembly withstands when backed by a specified device. Two conditions attach: the catalogue must give the figure, and the device installed must be the one named. Change the model or rating and the figure no longer applies. On that route the check runs against the actual let-through I²t, cut-off peak and coordination data for that named device, not the prospective fault current before limiting.
Hence tap-off units are often marked with a conditional short-circuit current, the trunking unit with a short-time withstand current — the two obtain their withstand differently: one itself, the other from the device upstream.
What is different near a transformer?
The factor table carries a note: the values cover most applications, but close to a transformer or a generator, where the power factor can be lower, the maximum prospective peak current can take over from the r.m.s. fault current as the limiting value.
That note points at the commonest place a busway is installed — the low-voltage terminals of a transformer, where the fault current is highest and the circuit's impedance ratio largest, so the first peak is highest relative to the r.m.s. value. Precisely where a busway most needs a careful check, the peak often bites first.
One illustration: a 1250 kVA transformer, 400 V on the secondary, 5% impedance voltage, gives a prospective fault current of about 36.1 kA on a three-phase bolted fault. But that number comes only from capacity, voltage and impedance voltage, and says nothing about the resistance-to-reactance ratio — and the peak is exactly what that ratio decides. For comparison, on a radial network with no separate converter peak term, taking the hypothetical R/X = 0.1, the peak factor is about 2.47 and the first peak about 89 kA; the conventional factor of 2.1 gives only 75.8 kA, nearly a fifth lower. Those three parameters alone give no peak that can release the on-site check. One level down, the impedance of the run pulls the current back and the distribution board faces noticeably less.
Three places this check gets misread
Mistaking a breaker's breaking capacity for a busway rating. A circuit-breaker's breaking capacity is set under the component standard: it answers whether the breaker can interrupt the current. A busway does not interrupt fault current, it carries it. Two test regimes; similar numbers do not transfer.
Quoting Icw without a time. A short-time withstand current with no time cannot be checked; a nameplate showing only "50 kA" begs the question — 1 s or 3 s?
Treating the two figures as interchangeable. The thermal check turns on I²t, the mechanical check on the peak; a conventional factor links them, but the mechanisms and limits differ, and both have to clear separately.
Open questions
- The operating settings used on data center busways. Whether the short delay is set at 0.1 s or 0.4 s, and whether it is coordinated with the level above, depends on the design; published sets of design values are scarce, and this article gives the method, not a setting.
- How finely manufacturers specify the device behind a conditional short-circuit current. Most public catalogues give only the two withstand currents, not a conditional current or limiting device.
- The word-for-word layout of the factor table itself. The standard carrying it has no public online reading because of adoption copyright; the values and bands here come from three independent transcriptions with the table number confirmed, but the table was not read directly.
- The equivalent impedance ratio R/X at the point of installation. Capacity, voltage and impedance voltage do not fix it; the short-circuit calculation for that point, or its network parameters, is needed before the on-site peak check can close.
References
Accessed 2026-10-08.
- IEC 61439-1:2020, public sample chapter contents. https://cdn.standards.iteh.ai/samples/21953/f3660106d5b948f38f3dc2a8562ef036/IEC-61439-1-2020.pdf
- GB/T 7251.1-2023, public reprint. https://hyjzrz.com/UploadFiles/file/20250819/20250819103687288728.pdf
- Icw, Ipk and Icc: How to Read a Low Voltage Switchboard Nameplate. https://www.ectricol.com/2026/09/29/icw-ipk-icc-low-voltage-switchboard-nameplate
- Filipino Engineer, IEC 61439 – Relationship between peak current and short-time current. https://filipinoengineer.com/blog/2022/11/iec-61439-relationship-between-peak-current-and-short-time-current.html
- Power Distribution Panels, Short-Circuit Withstand Strength (Icw) in Panel Design. https://powerdistributionpanels.net/knowledge/short-circuit-withstand-icw
- pandapower, Peak Short-Circuit Current (short-circuit calculation documentation). https://pandapower.readthedocs.io/en/latest/shortcircuit/ip.html
- Dynamic and thermal stability verification for low-voltage boards and busways. https://www.ybzhan.cn/tech_news/519676.html
- Technical requirements for short-circuit protection in low-voltage distribution systems. http://yunrun.com.cn/tech/3506.html
This article is an industry observation and does not constitute procurement advice. | Updated 2026-10
How is a busway's rated current determined? Why can't ampacity be calculated from cross-section?