
The short answer
No, not from the normal balanced current alone. In a dual-corded lineup, each path often carries about half the load, but the equipment rating is not cut in half. If either path must keep the downstream load running after the other path is lost, every busway on that path has to be checked at the full post-failure current, including any load rise inside the IT equipment. Half current describes normal operation. It is not a rating, and the 40% to 50% figure is an operating monitor threshold, not a discount factor for the busway.
If each path carries half, why not buy half the busway?
Take a common row: 24 racks at 8 kW each, or 192 kW in total, on a 400 V three-phase system at 0.95 power factor. The total line current is:
I = 192,000 ÷ (√3 × 400 × 0.95) = 291.714 A
With both paths sharing the load, each carries 145.857 A. The tempting conclusion is that a 160 A busway on each path is enough, with a little margin left over.
The word “normal” is where that reasoning breaks. Schneider Electric Data Center Science Center, Overload Protection in a Dual-Corded Data Center Environment (White Paper 206, Rev.0, 2014; hereafter WP 206), describes most dual-corded IT devices as sharing the load at roughly 50% ±10% per path. When one path is lost, the remaining path immediately takes 100%. The post-failure current is therefore 291.714 A, not 145.857 A.
A real facility case shows the same operating target. The Copper Development Association's Boise data center study records A/B busways kept at no more than 50% per path in normal operation. That is an operating target, not proof that half a rating is enough for the equipment.
A busway's rated current is an equipment capability. It does not double because the normal current happens to be half. At 160 A, the normal path current is already 91.161% of rating. After one path is lost, it is 182.321%. This is not a question of how much margin remains; the equipment is beyond its rating in the failure state.
The load can also rise. WP 206, page 3, notes that some servers speed up their fans when one supply is lost and the total device power may increase by up to 15%; it suggests planning for 10%. With that 10%, the surviving path must carry 320.885 A.
| Basis | Current to check on one path | Relative to normal |
|---|---|---|
| Normal sharing | 145.857 A | 1.00 times |
| One path lost | 291.714 A | 2.00 times |
| One path lost, load up 10% | 320.885 A | 2.20 times |
Which failure makes one path carry everything?
“Two paths” does not automatically mean that any failure anywhere transfers the whole downstream load to the other path. WP 206, page 6, separates two cases:
- A rack branch failure: the other branch to that rack usually doubles, while the path as a whole gains only one rack's share of load.
- A central UPS or complete path failure: every rack's other branch doubles, and every downstream branch plus the upstream path carries the transfer at the same time.
The two events differ greatly, and a branch failure does not spread evenly across the three phases. With eight racks per phase, each phase carries 32 kW per path, or 145.857 A. When one branch to a rack fails, its 4 kW moves to the phase that the rack's other branch sits on: the branch current goes from 18.232 A to 36.464 A, which is the doubling. The affected phase goes from 145.857 A to 164.089 A, an increase of 12.50%, while the other two phases stay at 145.857 A.
The path's total active power rises from 96 kW to 100 kW, an increase of 4.17%, and the arithmetic mean of the three phase currents also rises from 145.857 A to 151.934 A, likewise 4.17%. That mean is not the current in the affected phase: the transfer is concentrated there. A complete path loss takes all three phases to 291.714 A, an increase of 100%.
This explains a common field misread. Looking only at the path's total active power, or only at the average of the three phase currents, a branch failure shows 4.17% and the path looks generously sized. Yet on a 160 A busway the affected phase is already at 102.556% of rating while the total shows 4.17%. An average hides a single-phase exceedance, so the first question is which failure case the design requires, not how much the meter moved.
If the paths merge upstream, are two final cables still two paths?
WP 206, page 2, notes that the two paths may join at a distribution panel, the UPS output, switchgear, or the utility service. Some sites keep them separate all the way to separate substations; most extend the dual path to the facility switchgear and use a standby generator where there is only one utility feed. Uptime Institute, in Survey findings link higher redundancy to lower outage risk, defines 2N more strictly: a duplicate of the full required capacity, creating two independent paths or systems, each able to support the entire load.
Read together, two final cords prove only that two distribution paths exist. They do not prove 2N. If the paths merge at the same upstream busway, transformer, or switchboard, a fault above that point can affect both. WP 206 would still call the arrangement dual-path, but its failure domain no longer meets Uptime's independent 2N definition. The sizing condition used here is not “the site must be 2N”; it is “the design must require the surviving path to carry the entire downstream load.”
The sizing conclusion here has a condition: the project must require the surviving path to carry the entire downstream load. If the design permits load shedding, workload migration, or a shutdown after one path is lost, that condition does not hold and the check must use the project's defined failure case. Turning a conditional rule into “every dual path must be fully rated” is just as inaccurate as sizing from half current.
What separates 160 A, 250 A, and 400 A?
Put three ratings against the same current and the difference is visible:
| Rating | Normal per path | One path lost | One path lost, load up 10% |
|---|---|---|---|
| 160 A | 91.161% | 182.321% | 200.553% |
| 250 A | 58.343% | 116.686% | 128.354% |
| 400 A | 36.464% | 72.928% | 80.221% |
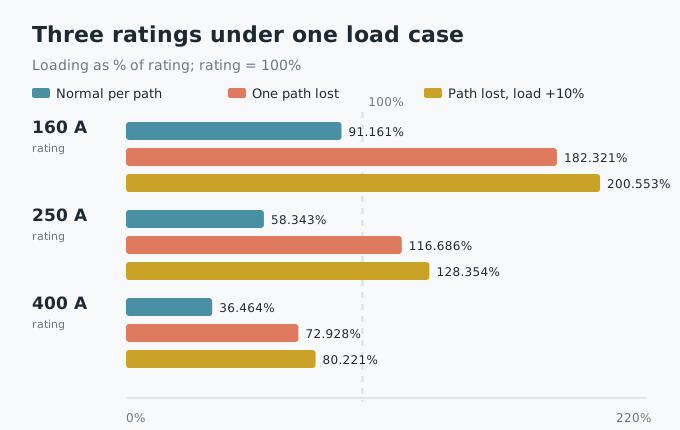
The 160 A case is not merely overloaded after a failure. It already runs at 91.161% in normal operation, leaving little room for load growth, phase imbalance, or temperature correction. The 250 A case looks comfortable at 58.343% in normal operation, but reaches 116.686% after one path is lost. Only the 400 A case, at 80.221% with the load rise, has steady-state current headroom worth discussing.
The 400 A column is an arithmetic comparison, not a procurement answer. Actual busway ampacity also depends on ambient temperature, installation, tap-off density, harmonics, and altitude. This article separates only the power-frequency steady-state current layer; it does not replace a product selection.
If the requirement is to carry the full load plus a 10% rise on the surviving path, the minimum current to check is 320.885 A. That number rules out 160 A and 250 A for this failure case. It does not prove that any particular product is suitable.
Is the 40% to 50% monitor threshold a sizing factor?
No. WP 206, page 7, starts from the ideal dual-path case: any failure can at most double the load on the other path, so no circuit should be operated above 50% of its design rating. Real systems include power-switch devices and loads that rise after a supply is lost, so experience leads to a practical 40% monitor threshold. If the device load rises to 110%, the threshold becomes 45%.
Those numbers govern the operating margin between normal current and the design value. They do not say that the equipment rating may be cut to 40%. Treating 40% as a busway derating factor goes wrong in two directions: it turns an operating limit into an equipment rating, and it hides the full-load current that the failure case actually requires.
WP 206 does not state 45.455%. It gives an experience rule: for every 1% rise in device load, lower the monitor threshold by 0.5%, which maps 110% to 45%. A separate inverse calculation, 50% ÷ 1.10, gives 45.455%. The two are close but not the same derivation.
What if the server supplies do not share the load?
That changes the normal reading. It does not change the need to check the full post-failure load.
WP 206, page 4, says fewer than 5% of dual-corded devices are the power-switch type: they draw all power from one cord in normal operation and switch to the other when the primary input fails. The switch may take up to 25 ms, during which the power supply rides on its internal capacitors. When the transfer completes, the active supply must not only carry the IT load but recharge those capacitors. The load can briefly reach 150% of the IT requirement, or more, for up to 50 ms.
Two consequences follow. First, the two paths may be badly unbalanced in normal operation, so “half on each” is not a description of the actual current. An operator who sees a lightly loaded path must not treat its headroom as free capacity. Second, the transfer transient is not covered by a steady-state current rating; protection coordination and the upstream dynamic response need a separate check.
The 50/50 example here applies to power-share devices. If a row mixes in power-switch devices, measure the normal current on each path, keep the full-load check for the post-transfer steady state, and treat the brief 150% as a separate dynamic problem. A steady-state busway rating cannot be used to absorb that transient by itself.
What is outside this calculation?
- Only steady-state power-frequency current is calculated. Temperature rise, voltage drop, harmonics, short-circuit withstand, and protection coordination are not included.
- The 24 racks are assumed to be fully balanced, eight per phase, with each path taking half; branch circuits are single-phase at 400/√3 V, while path totals use the three-phase line current. A real project needs phase-by-phase and branch-by-branch measurements.
- The load power factor is 0.95, and the total load rises 10% after a path is lost. Change either value and every current changes.
- The 400 A column is arithmetic only. It is not a product-series statement or a procurement conclusion.
- The calculation does not verify whether the two paths are truly independent upstream, nor does it cover single-corded equipment, rack ATS units, or two cords accidentally plugged into the same path.
Open questions
For a specific project, the busway size still needs three sets of inputs: the loss-of-path power waveform for every server, especially the share and simultaneity of power-switch devices; the actual ampacity of the busway at the site's ambient temperature, installation, tap-off density, and harmonic spectrum; and the dynamic response and coordination of the upstream transformers, UPS units, feeders, and protective devices during the transfer.
WP 206 provides a behavior framework and monitoring rules for dual-path environments, not a selection table for a particular busway. Turning the framework into equipment ratings still requires the project single-line diagram, load schedule, and product test data.
References
- Schneider Electric Data Center Science Center, Overload Protection in a Dual-Corded Data Center Environment, White Paper 206, Rev.0, 2014. https://www.se.com/uk/en/download/document/SPD_VAVR-9HPW2X_EN/
- Uptime Institute Journal, Survey findings link higher redundancy to lower outage risk, accessed 2026-11-13. https://journal.uptimeinstitute.com/survey-findings-link-higher-redundancy-to-lower-outage-risk/
- Copper Development Association, Copper Grounding System Guarantees 100 Percent Uptime for Boise Data Center, A/B busway case study. https://copper.org/?p=1418
This article is an industry observation and does not constitute procurement advice. | Updated 2026-11