
Conclusion
The allowable values in Table 2 of GB/T 14549 are the amount that all users together at the point of common coupling must not exceed, not the limit for one user. To apply the limit to an individual user, the standard specifies two steps: first convert it using the ratio of the actual minimum short-circuit capacity at that point to the reference short-circuit capacity; then allocate it using the ratio of that user's contracted capacity to the supply-equipment capacity at the point of common coupling. Allocation is not proportional to capacity—the exponent is determined by harmonic order, so the same capacity share receives more as the order increases. If both steps are skipped and the Table 2 reference value is used directly as the limit, the result can be several times higher than the correct value when the capacity share is small and the grid's short-circuit capacity is greater than the reference value.
Whose limit is the number in Table 2, exactly?
Clause 5.1 of the standard says that the harmonic-current components (RMS values) injected by all users at the point of common coupling must not exceed the allowable values specified in Table 2. The subject is “all users,” so Table 2 controls the total harmonic current at that point. It is the input to the allocation calculation, not the endpoint.
Table 2 is arranged by voltage level, with one reference short-circuit capacity attached to each row: 0.38 kV uses 10 MVA, 6 kV and 10 kV both use 100 MVA, 35 kV uses 250 MVA, 66 kV uses 500 MVA, and 110 kV uses 750 MVA; a table note adds that 220 kV uses a reference short-circuit capacity of 2000 MVA. Each row gives the allowable value for each order, up to the 20th. Take the 10 kV, 100 MVA row as an example (unit: A):
| Harmonic order | 2 | 3 | 5 | 7 | 11 | 13 | 20 |
|---|---|---|---|---|---|---|---|
| Allowable harmonic current | 26 | 20 | 20 | 15 | 9.3 | 7.9 | 2.6 |
These numbers are the starting point of the chain; they cannot be transferred directly to any individual user.
Why should the value be scaled when the short-circuit capacity differs from the reference value?
For a harmonic current of the same size, injecting it into a grid with greater capacity produces a lower harmonic-voltage content. The conversion formula in Appendix B is I_h = I_hp × S_K1 ÷ S_K2: S_K1 is the minimum short-circuit capacity at the point of common coupling, S_K2 is the reference short-circuit capacity for the corresponding row in Table 2, and I_hp is the value in Table 2. The greater the short-circuit capacity, the greater the permitted harmonic-current injection.
Here is one calculation: the 10 kV row in Table 2 uses a 100 MVA reference, and its allowable 5th-order harmonic current is 20 A. If the minimum short-circuit capacity at the point is 200 MVA, the allowable value becomes 40 A.
The qualifier here is minimum short-circuit capacity. Short-circuit capacity changes when the grid operating mode changes. Using the minimum is equivalent to setting the limit for the most adverse operating mode, so the calculated allowable value is also the smallest. Replacing it with an average or maximum short-circuit capacity gives a looser result, which is not the standard's stated basis.
How much can one user receive? Why is it not proportional to capacity?
Clause 5.2 says only this: each user's allowable value is allocated according to the ratio of that user's contracted capacity at the point to the supply-equipment capacity at its point of common coupling; the method is given in Appendix C. The allocation formula in Appendix C is:
I_hi = I_h × (S_i ÷ S_t) ^ (1 ÷ α)
S_i is the electricity-use contracted capacity of user i, S_t is the supply-equipment capacity at the point, I_h is the converted allowable value, and α is the phase-superposition coefficient. Table C2 gives: 1.1 for the 3rd order, 1.2 for the 5th, 1.4 for the 7th, 1.8 for the 11th, 1.9 for the 13th, and 2 for the 9th, orders above the 13th, and even orders.
The key is that α appears in the exponent, so this is not a straight line. A user's contracted capacity cannot exceed the supply-equipment capacity at that point, so the ratio is always no greater than 1. In this interval, the larger α is and the smaller the exponent is, the more the user's allocated share exceeds its own capacity share—the excess is a relative share, not an absolute amount.
With the same 10% capacity share, why can the 11th order receive more than twice the 3rd order?
Substitute a fixed capacity share of 0.10 into the allocation formula:
| Harmonic order | 3 | 5 | 7 | 11 | 13 | 9th and even orders |
|---|---|---|---|---|---|---|
| Phase-superposition coefficient α | 1.1 | 1.2 | 1.4 | 1.8 | 1.9 | 2.0 |
| Allocated share | 0.1233 | 0.1468 | 0.1931 | 0.2783 | 0.2976 | 0.3162 |
The capacity share is 0.10 in every case: the 3rd order receives 0.1233, the 11th receives 0.2783, and the 9th and even-order group receives 0.3162—the largest share is 2.56 times the smallest.
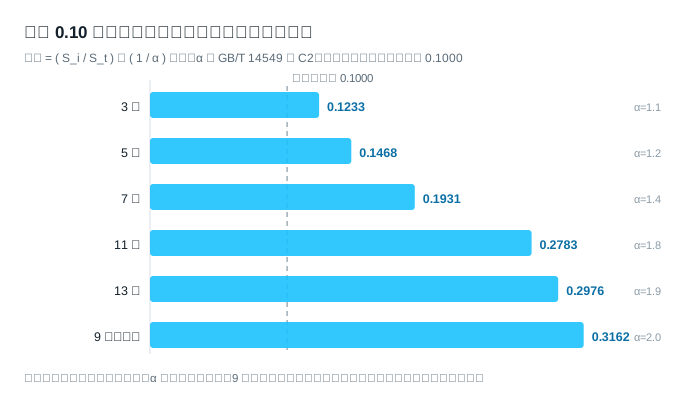
In other words, the intuition of “allocate in proportion to capacity” is only roughly true around the 3rd harmonic. As the order increases, allocation tilts toward users with smaller capacity. The smaller the capacity share, the more obvious the tilt: at a share of 0.01, the 9th and even-order group receives 0.1000, which is 10 times its capacity share.
When two harmonic sources are superimposed, do they use the same coefficients as “allocation”?
Not the same table, but the direction is consistent.
Another part of Appendix C governs superposition: same-order harmonic currents from two harmonic sources superimposed on the same phase of one line are calculated with a formula containing the cosine of the phase angle when the phase angle is known; when it is uncertain, the calculation is I_h = √(I_h1² + I_h2² + K_h × I_h1 × I_h2), where Table C1 gives K_h as 1.62 for the 3rd order, 1.28 for the 5th, 0.72 for the 7th, 0.18 for the 11th, 0.08 for the 13th, and 0 for the 9th, orders above the 13th, and even orders. For three or more harmonic sources, calculate two first, then superimpose the result with the third.
The two tables point in the same direction: K_h falls from 1.62 to 0, while the exponent 1 ÷ α falls from 0.9091 to 0.5000. The case where K_h is 0 lines up: two equal-capacity sources have a combined total 1.4142 times that of one source rather than twice as much; on the allocation side, two equal-capacity users each receive 0.7071, for the same combined total of 1.4142. The group with α set to 2 (9th, above-13th, and even orders) is equivalent to square-root allocation, which is the same result as the case where K_h is 0.
Keep in mind that the two tables govern different things: K_h governs how the actual currents of multiple harmonic sources are added, while α governs how the limit is allocated. Their directions can be compared, but their numbers cannot be used to verify one another—use each according to its own purpose when citing it.
Once measured values are available, how should they be compared with the allowable value?
Appendix D4 specifies that the value used to determine whether harmonics exceed the allowable value is neither the average nor the maximum. It is the largest phase value among the 95th-percentile values of the measured values for each phase during the measurement period. For a harmonic source whose load changes slowly, five close measured values may be selected and averaged arithmetically. The standard also gives a practical approximation for the 95th-percentile value: arrange the measured values from largest to smallest, discard the largest 5%, and take the largest of the remaining measured values.
The measurement-count requirement is easy to remember incorrectly. Appendix D2 says that “the harmonic orders measured are generally the 2nd to the 19th; according to the characteristics of the harmonic source or the test-analysis results, the range of harmonic orders measured may be adjusted as appropriate,” while Table 2 gives values through the 20th order. The allowable-value side leaves one order of headroom, while the measurement side generally requires only through the 19th order; the two specifications are not synchronized.
For harmonic sources with rapidly changing loads (electric arc furnaces, rolling mills supplied by thyristor converter equipment, electric locomotives, and so on), Appendix D3 requires a measurement interval of no more than 2 min and generally at least 30 measurements. For harmonic sources with slowly changing loads, such as chemical rectifiers, it does not specify the measurement interval or duration. The measured number is compared with the allocated limit, not directly with the Table 2 reference value.
Can the “new edition of the harmonic national standard” circulating online be trusted?
After checking item by item, several commonly repeated claims have no corresponding wording in the standard.
The number cannot be found. A search for GB/T 14549 on the public standards-information platform returns only the 1993 edition, which is current; it was published in July 1993 and implemented in March 1994. Its review date was December 2021, with the conclusion “revise”—it has been placed on the revision list, but no new edition has been published.
The limit values have been put in the wrong row. A technical explanation page from a testing institution writes the voltage total harmonic-distortion limit for 0.38 kV as no more than 4.0%, while Table 1 gives a total distortion of 5.0% for 0.38 kV; 4.0% is the total-distortion value for the 6 kV and 10 kV row. In the same table, the odd-harmonic content for 0.38 kV also happens to be 4.0%, making it easy to copy it as the total-distortion value.
The measurement range has been expanded. Pages of the same type write “measure the 2nd–40th orders” or “2nd–25th orders,” while the original wording of Appendix D2 is “2nd to 19th,” and Table 2 itself lists only through the 20th order.
Interharmonics have been folded in. Interharmonics are outside the scope of this standard—Chapter 1 states that transient phenomena and short-duration harmonics are not applicable, and neither the main text nor its four appendices gives interharmonic limits. Interharmonic limits are specified by another current standard, GB/T 24337-2009, Quality of Electric Energy—Interharmonics in Public Supply Network, whose scope covers public supply networks at nominal voltages of 220 kV and below.
So the only safe record is this: as of September 2026, the public standards-information platform has no version of GB/T 14549 other than the 1993 edition. This does not mean a new edition will never exist, but it is sufficient for an operational conclusion—until a new number and limit table appear on the standards platform, do not use them to revise a technical agreement or a harmonic criterion.
Questions that still have no answer
- Will the allocation method change after revision: the review conclusion is “revise,” but no draft or publication schedule has been made public. It is impossible to tell whether the α and K_h approximations will be unified.
- How should multiple users at one point of common coupling be coordinated when all simultaneously take their full allocation: the allocation formula is calculated user by user, and if multiple users each take their full amount, the shares add up to more than the total (two equal-capacity users already total 1.0650). Chapter 5 of the standard has only Clauses 5.1 and 5.2 and provides no coordination clause for this case.
References
- GB/T 14549-1993, Quality of Electric Energy Supply—Harmonics in Public Supply Network, full standard text (including Tables 1 and 2 and Appendices A–D), standard file published on the Lixin County People's Government website, https://www.lixin.gov.cn/file_bz/3/202505/20250529c6886cfab1b44eb1aa3bacb311717ffd.pdf (2026-09-20)
- GB/T 14549-1993 entry (standard status, publication and implementation dates, review date and conclusion), National Public Service Platform for Standards Information, https://std.samr.gov.cn/gb/search/gbDetailed?id=71F772D7F6ACD3A7E05397BE0A0AB82A (2026-09-20)
- GB/T 14549-1993 entry, National Standards Full-Text Publicity System, https://openstd.samr.gov.cn/bzgk/std/newGbInfo?hcno=10A576E61901DA59E9A6AC555C2BAFD1 (2026-09-20)
- GB/T 24337-2009, Quality of Electric Energy—Interharmonics in Public Supply Network, entry (standard status, review date and conclusion), National Public Service Platform for Standards Information, https://std.samr.gov.cn/gb/search/gbDetailed?id=71F772D7CE43D3A7E05397BE0A0AB82A (2026-09-20)
- GB/T 24337-2009 entry (publication and implementation dates), National Standards Full-Text Publicity System, https://openstd.samr.gov.cn/bzgk/std/newGbInfo?hcno=4FDA21610CB066028B7469FC405C72D6 (2026-09-20)
- GB/T 24337-2009 standard status and scope, Ningbo Standardization Public Service Platform, https://cnnbzj.com/cn/bzjdjs/Detail_31f46d3e2a7542aca358075a91202397.html (2026-09-20)
- Technical explanation of harmonic limits and measurement counts, public page of a testing institution, https://www.xnytest.com/gb-t-14549/ (2026-09-20)
- GB/T 14549-1993 entry and scope summary, Gongbiao website, http://csres.com/detail/54060.html (2026-09-20)
This article is an industry observation and does not constitute procurement advice. | Updated September 2026